
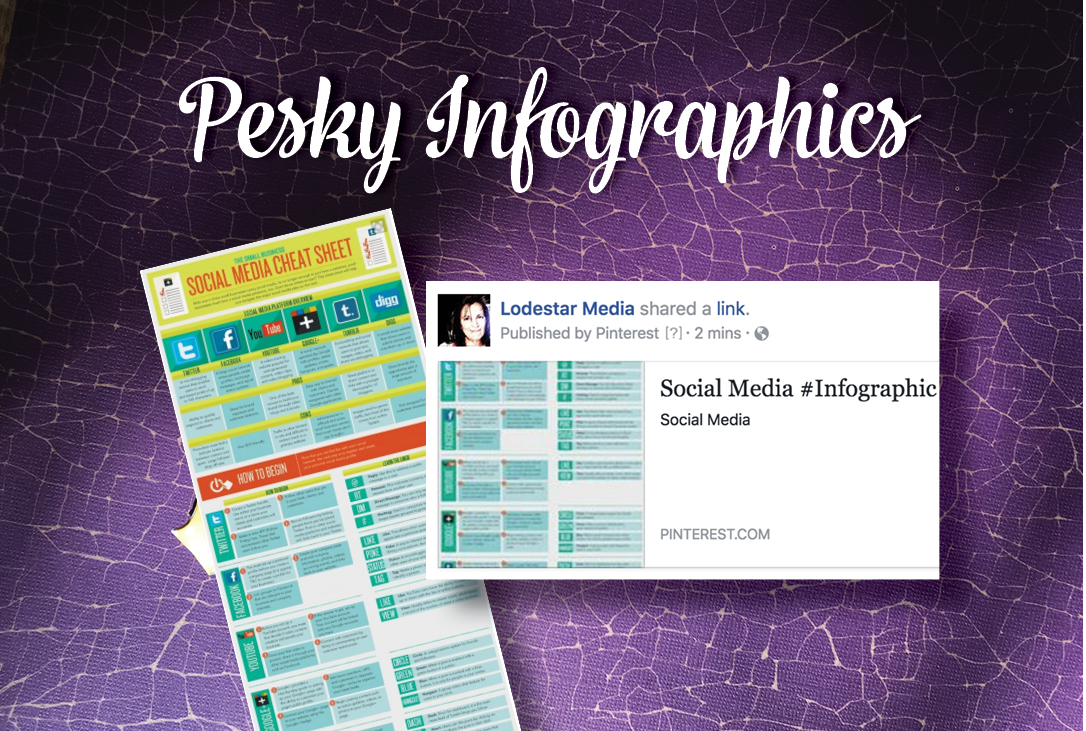
The best thing to do is post your infographic within your blog article. Because of the long, narrow format of an infographic, it needs a long, narrow space to do it justice. [fusion_builder_container hundred_percent=”yes” overflow=”visible”][fusion_builder_row][fusion_builder_column type=”1_1″ background_position=”left top” background_color=”” border_size=”” border_color=”” border_style=”solid” spacing=”yes” background_image=”” background_repeat=”no-repeat” padding=”” margin_top=”0px” margin_bottom=”0px” class=”” id=””…
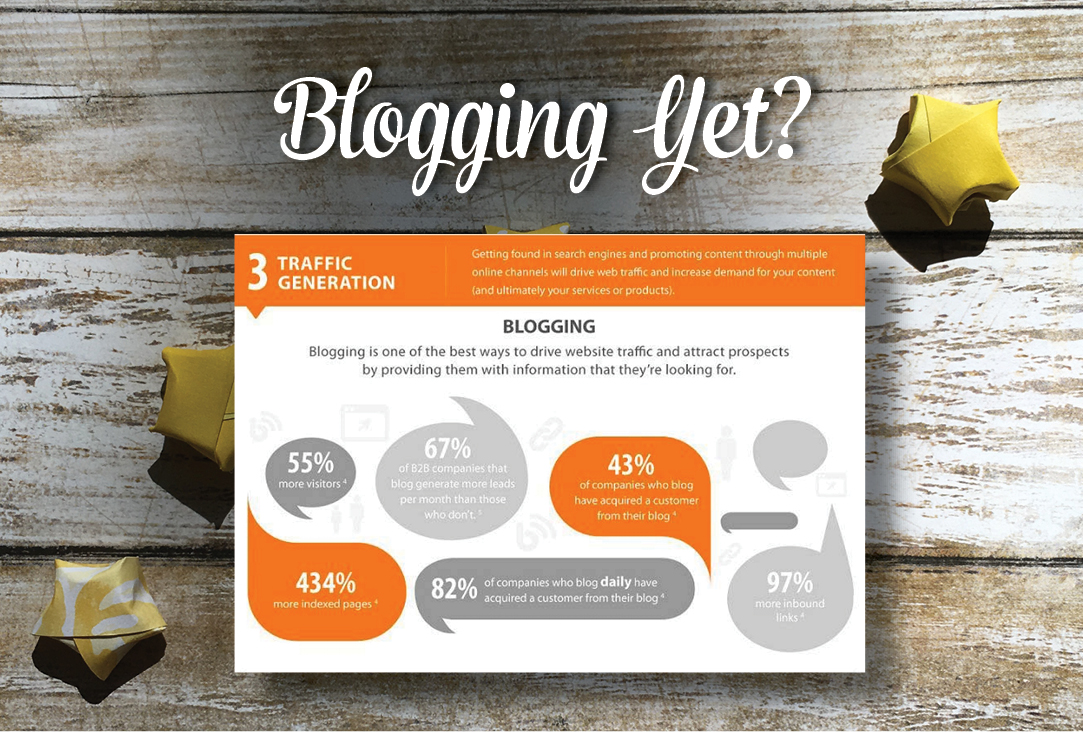
I’ve highlighted part of this infographic (click on the image to read the whole piece) to look at some very interesting stats for businesses who practice Internet marketing. Generating Leads This graphic says “67% of B2B companies that blog generate more leads than companies that don’t.” That’s a pretty important…

Sometimes you can see the actual ROI of using Facebook…right there on your Facebook Page in one of your reader’s comment. And when you see that, make sure to comment back and “like” the comment so he or she knows you’ve seen it. Sometimes it sparks a conversation that reaches…